| __timestamp | CGI Inc. | Synopsys, Inc. |
|---|---|---|
| Wednesday, January 1, 2014 | 1813301000 | 441543000 |
| Thursday, January 1, 2015 | 1845401000 | 496245000 |
| Friday, January 1, 2016 | 1929339000 | 540351000 |
| Sunday, January 1, 2017 | 1962419000 | 584909000 |
| Monday, January 1, 2018 | 2092453000 | 581213000 |
| Tuesday, January 1, 2019 | 2136374000 | 761347000 |
| Wednesday, January 1, 2020 | 2192519000 | 857403000 |
| Friday, January 1, 2021 | 2451697000 | 1101071000 |
| Saturday, January 1, 2022 | 2528385000 | 1435158000 |
| Sunday, January 1, 2023 | 2736123000 | 1647785000 |
| Monday, January 1, 2024 | 2822924000 | 1355711000 |
Unleashing insights
In the ever-evolving landscape of technology and consulting, understanding financial health is crucial. Over the past decade, from 2014 to 2024, Synopsys, Inc. and CGI Inc. have demonstrated distinct trajectories in their EBITDA performance. CGI Inc., a leader in IT and business consulting, has consistently outperformed Synopsys, Inc., a key player in electronic design automation, with an average EBITDA nearly 150% higher.
This comparison highlights the dynamic nature of these industries and the strategic maneuvers each company has employed to navigate their respective markets.
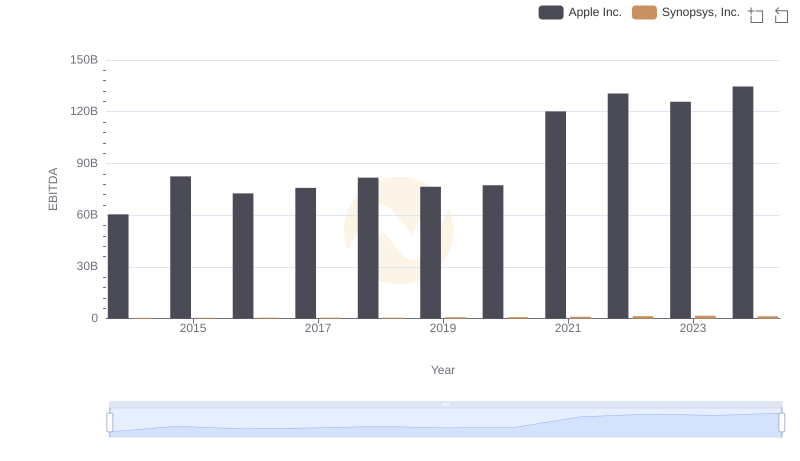
Professional EBITDA Benchmarking: Apple Inc. vs Synopsys, Inc.
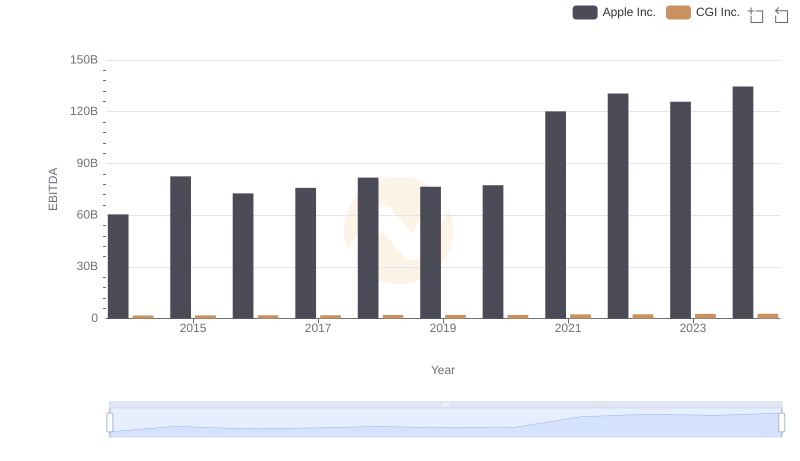
EBITDA Performance Review: Apple Inc. vs CGI Inc.
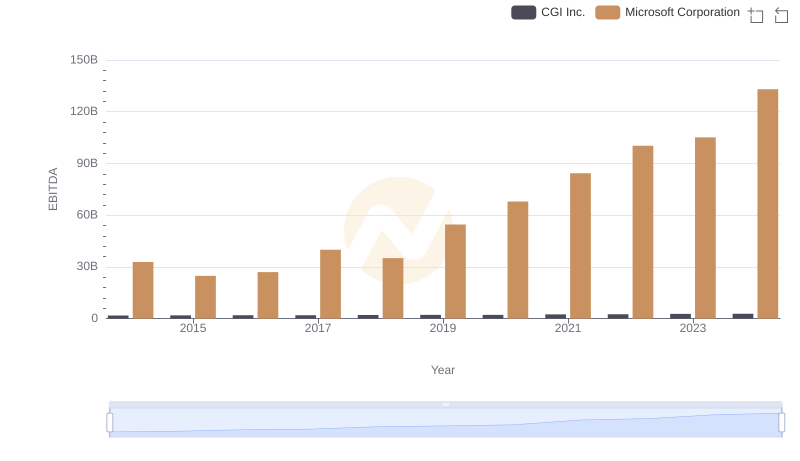
Professional EBITDA Benchmarking: Microsoft Corporation vs CGI Inc.
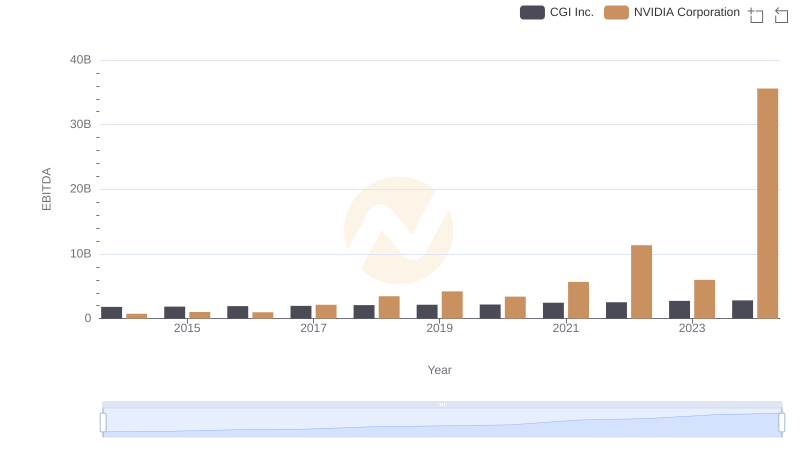
EBITDA Analysis: Evaluating NVIDIA Corporation Against CGI Inc.
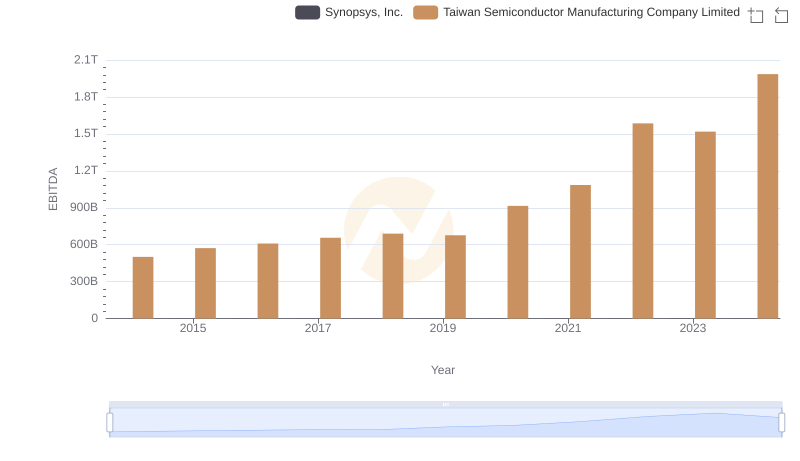
EBITDA Performance Review: Taiwan Semiconductor Manufacturing Company Limited vs Synopsys, Inc.

EBITDA Performance Review: Taiwan Semiconductor Manufacturing Company Limited vs CGI Inc.
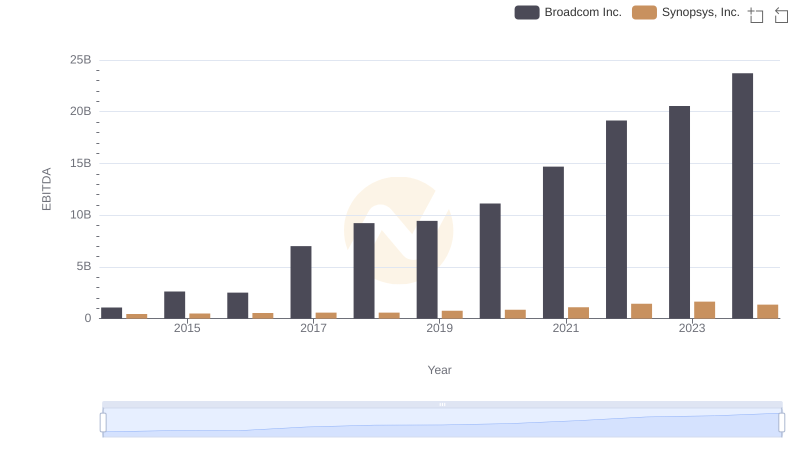
Broadcom Inc. vs Synopsys, Inc.: In-Depth EBITDA Performance Comparison
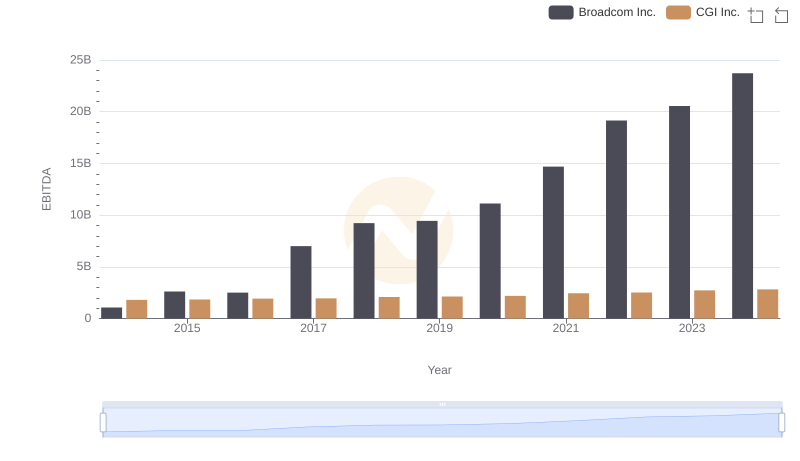
A Side-by-Side Analysis of EBITDA: Broadcom Inc. and CGI Inc.
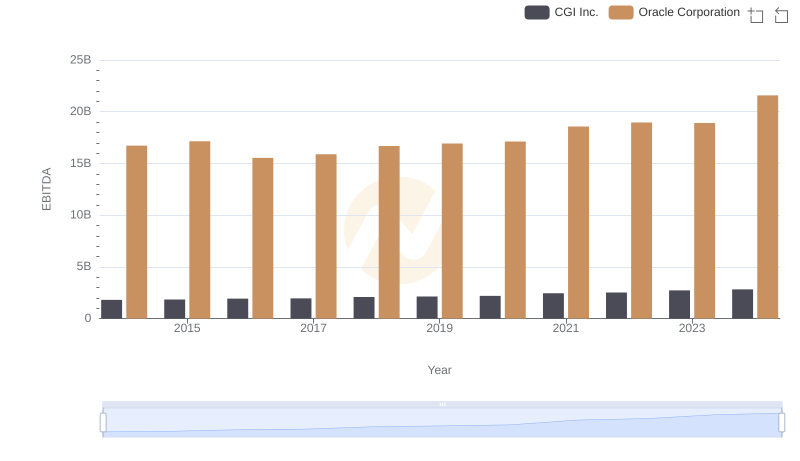
Professional EBITDA Benchmarking: Oracle Corporation vs CGI Inc.
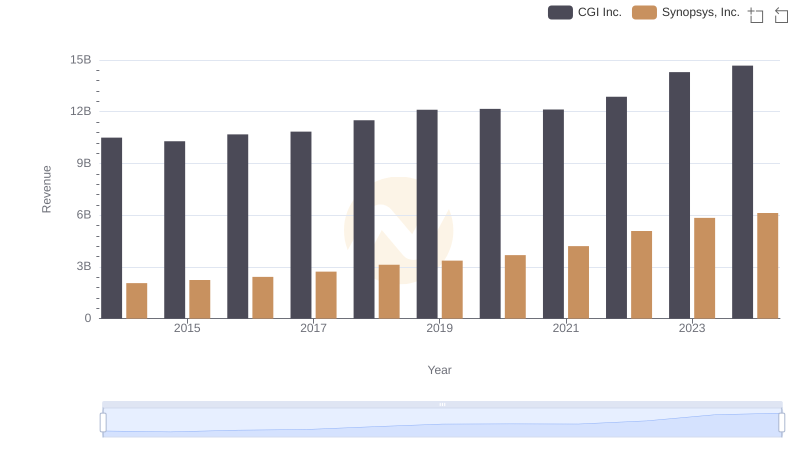
Annual Revenue Comparison: Synopsys, Inc. vs CGI Inc.
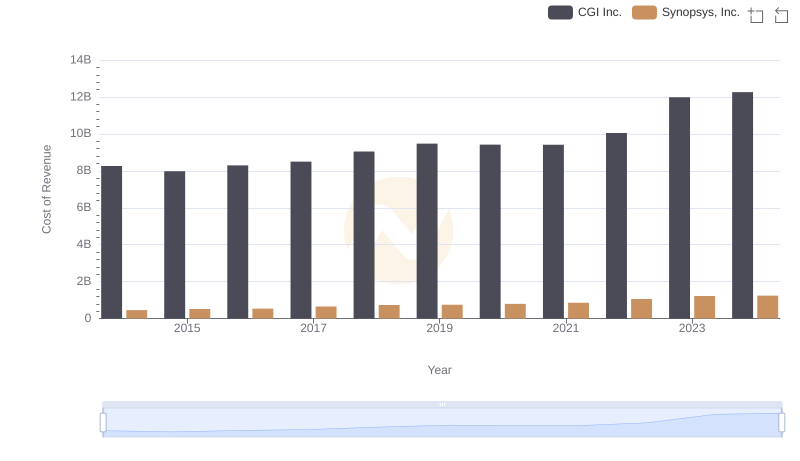
Cost Insights: Breaking Down Synopsys, Inc. and CGI Inc.'s Expenses
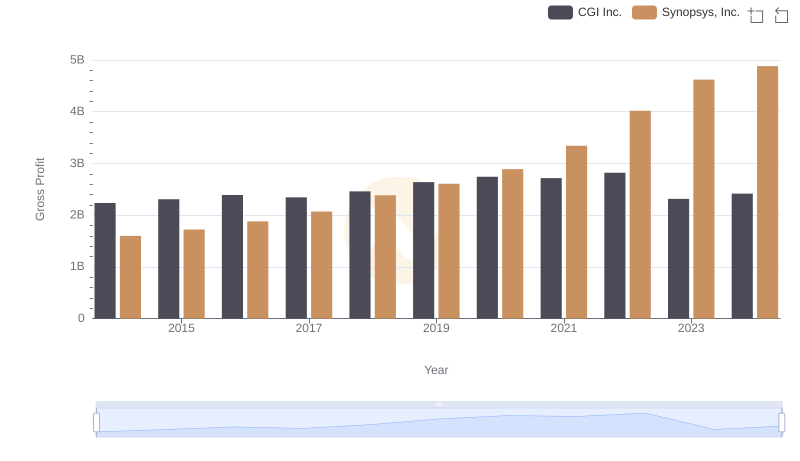
Gross Profit Comparison: Synopsys, Inc. and CGI Inc. Trends