| __timestamp | Block, Inc. | NetEase, Inc. |
|---|---|---|
| Wednesday, January 1, 2014 | 850192000 | 11712834000 |
| Thursday, January 1, 2015 | 1267118000 | 22802895000 |
| Friday, January 1, 2016 | 1708721000 | 38178844000 |
| Sunday, January 1, 2017 | 2214253000 | 54102019000 |
| Monday, January 1, 2018 | 3298177000 | 67156453000 |
| Tuesday, January 1, 2019 | 4713500000 | 59241145000 |
| Wednesday, January 1, 2020 | 9497578000 | 73667133000 |
| Friday, January 1, 2021 | 17661203000 | 87606026000 |
| Saturday, January 1, 2022 | 17531587000 | 96495809000 |
| Sunday, January 1, 2023 | 21915623000 | 103468159000 |
Infusing magic into the data realm
In the ever-evolving landscape of global technology, two giants, NetEase, Inc. and Block, Inc., have showcased remarkable revenue growth over the past decade. From 2014 to 2023, NetEase, Inc. has consistently outperformed Block, Inc., with its revenue growing by approximately 785%, reaching over $103 billion in 2023. In contrast, Block, Inc. has seen a staggering increase of over 2,500%, culminating in a revenue of around $22 billion in the same year.
This comparison underscores the dynamic growth trajectories of these tech titans, each carving its niche in the global market.
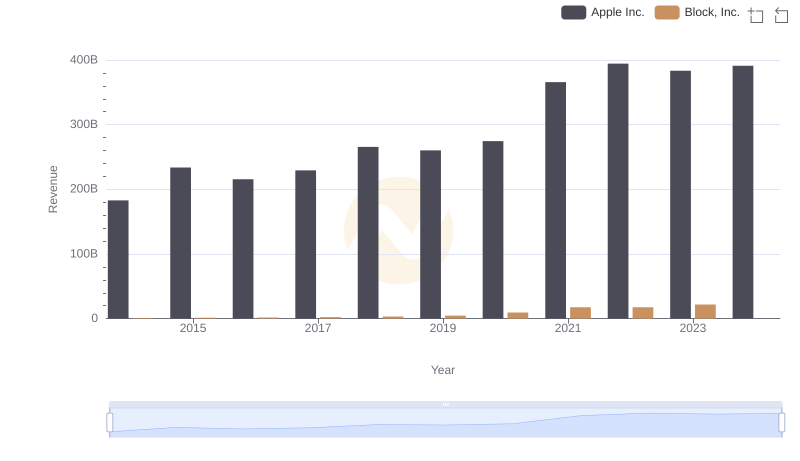
Revenue Insights: Apple Inc. and Block, Inc. Performance Compared
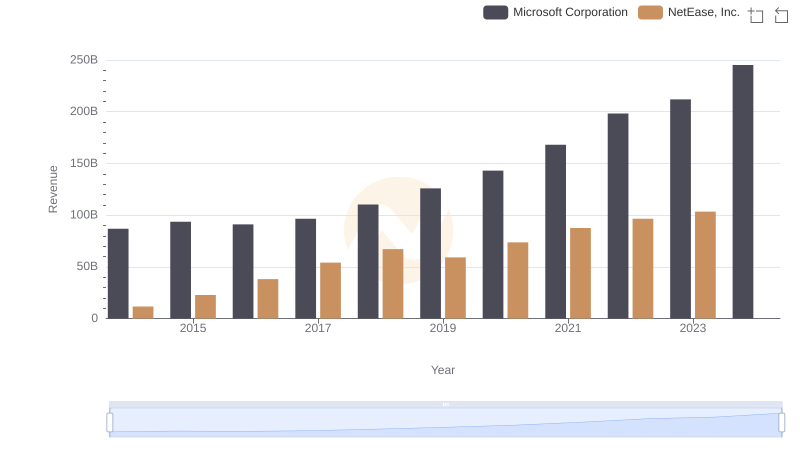
Who Generates More Revenue? Microsoft Corporation or NetEase, Inc.
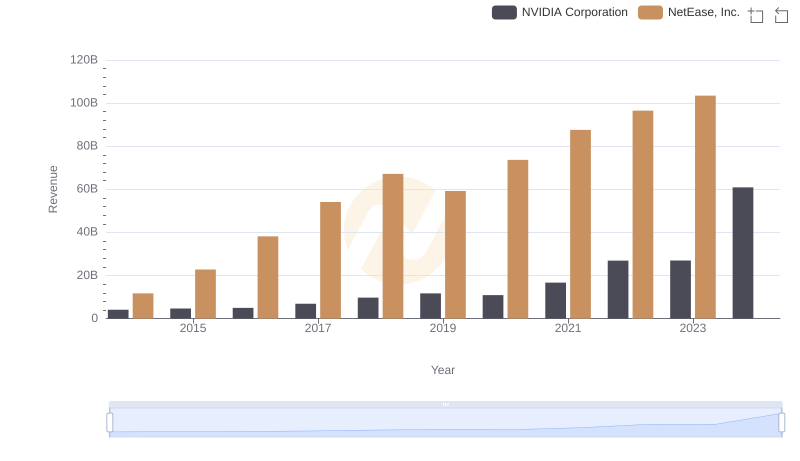
Revenue Insights: NVIDIA Corporation and NetEase, Inc. Performance Compared
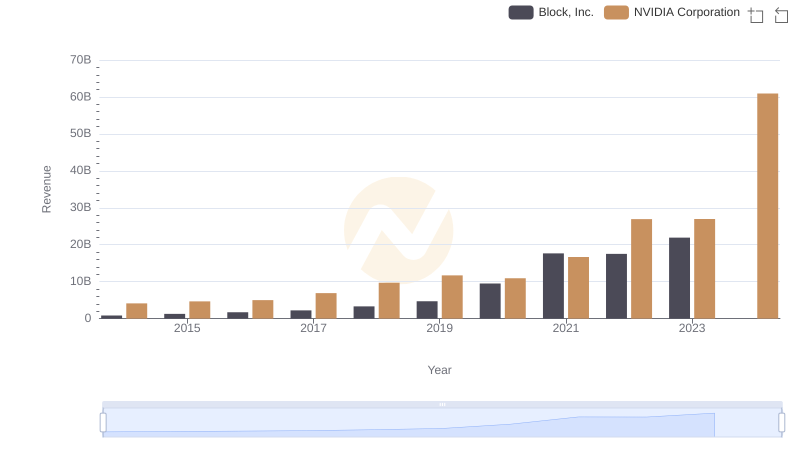
Annual Revenue Comparison: NVIDIA Corporation vs Block, Inc.
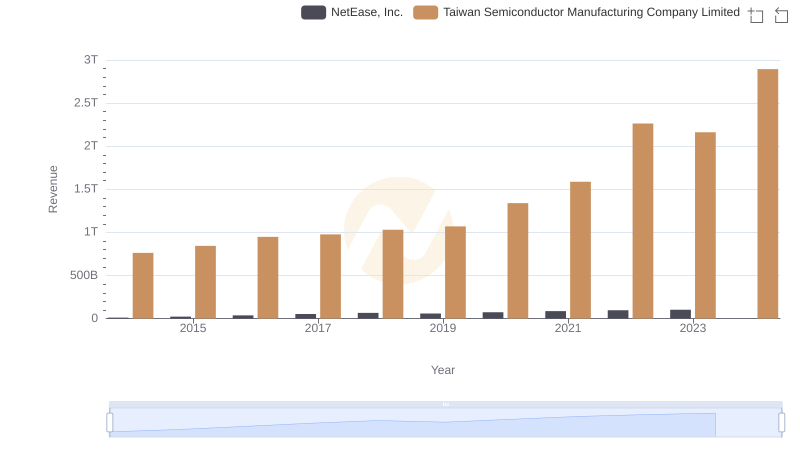
Revenue Showdown: Taiwan Semiconductor Manufacturing Company Limited vs NetEase, Inc.
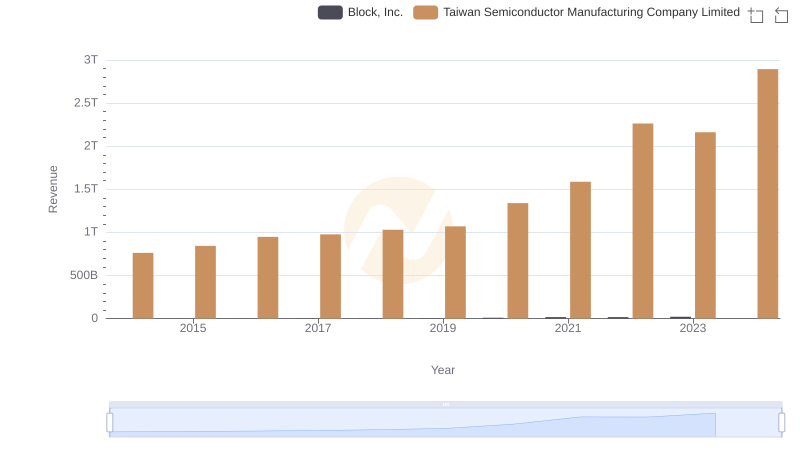
Taiwan Semiconductor Manufacturing Company Limited vs Block, Inc.: Annual Revenue Growth Compared
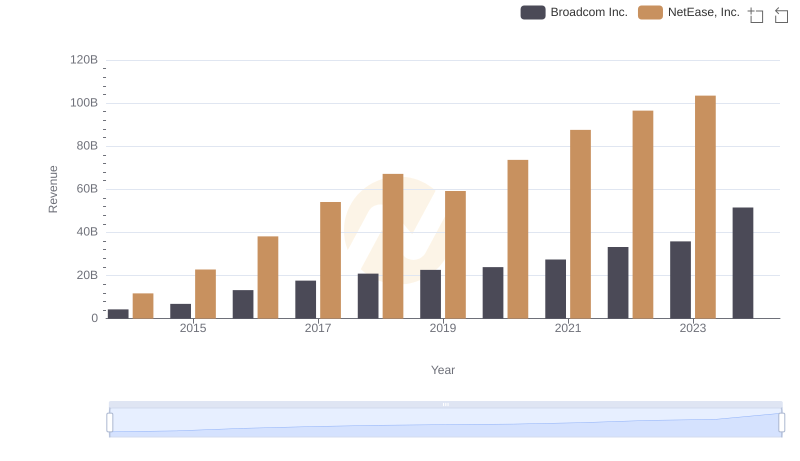
Breaking Down Revenue Trends: Broadcom Inc. vs NetEase, Inc.

Who Generates More Revenue? Broadcom Inc. or Block, Inc.
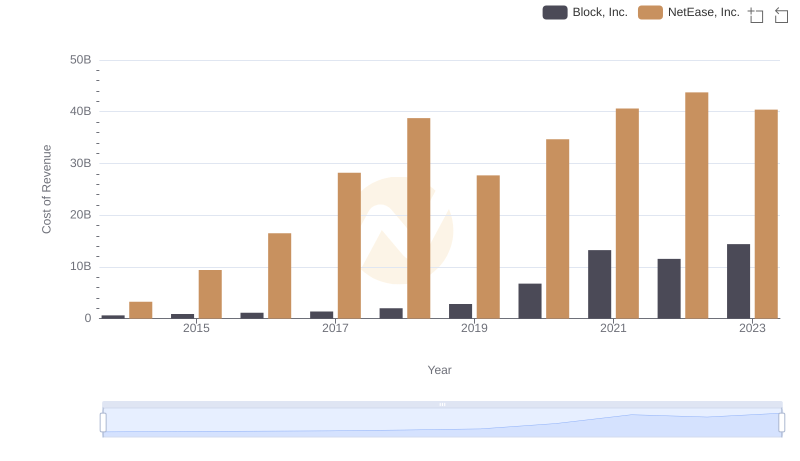
Cost of Revenue Trends: NetEase, Inc. vs Block, Inc.
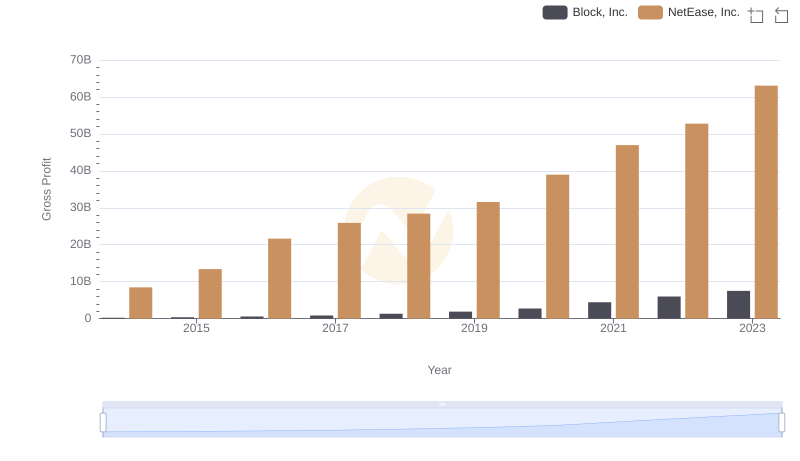
Gross Profit Trends Compared: NetEase, Inc. vs Block, Inc.
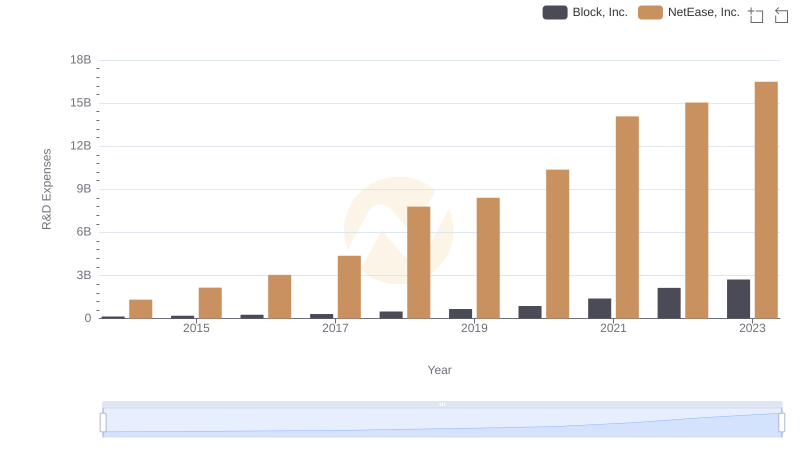
Comparing Innovation Spending: NetEase, Inc. and Block, Inc.
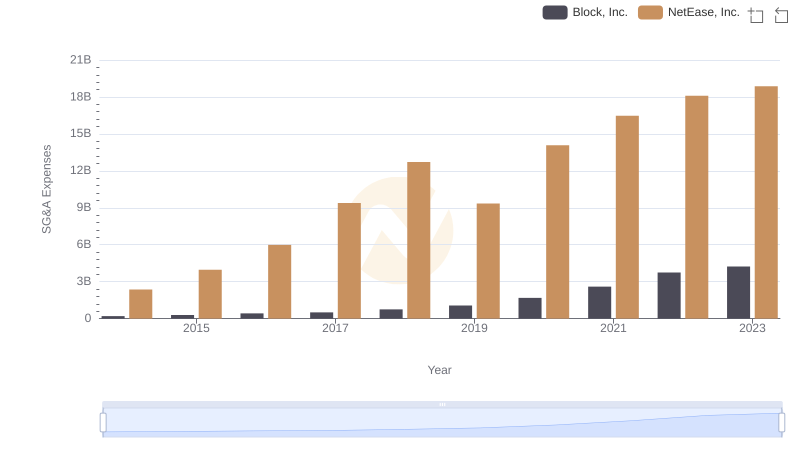
Selling, General, and Administrative Costs: NetEase, Inc. vs Block, Inc.