| __timestamp | Ryanair Holdings plc | Watsco, Inc. |
|---|---|---|
| Wednesday, January 1, 2014 | 3838100000 | 2988138000 |
| Thursday, January 1, 2015 | 3999600000 | 3105882000 |
| Friday, January 1, 2016 | 4355900000 | 3186118000 |
| Sunday, January 1, 2017 | 4294000000 | 3276296000 |
| Monday, January 1, 2018 | 4512300000 | 3426401000 |
| Tuesday, January 1, 2019 | 5492800000 | 3613406000 |
| Wednesday, January 1, 2020 | 6039900000 | 3832107000 |
| Friday, January 1, 2021 | 1702700000 | 4612647000 |
| Saturday, January 1, 2022 | 4009800000 | 5244055000 |
| Sunday, January 1, 2023 | 7735000000 | 5291627000 |
| Monday, January 1, 2024 | 9566400000 | 5573604000 |
Unleashing the power of data
In the ever-evolving landscape of global business, understanding cost dynamics is crucial. This analysis delves into the cost of revenue trends for Ryanair Holdings plc and Watsco, Inc. from 2014 to 2023. Ryanair, a titan in the airline industry, has seen its cost of revenue soar by approximately 150% over the decade, peaking in 2023. This surge reflects the airline's aggressive expansion and operational challenges. In contrast, Watsco, a leader in HVAC distribution, experienced a steadier growth of around 77% in its cost of revenue, highlighting its stable market position.
Interestingly, 2021 marked a significant dip for Ryanair, with costs plummeting to nearly half of the previous year, likely due to the pandemic's impact. Meanwhile, Watsco's costs continued to rise, underscoring its resilience. The data for 2024 remains incomplete, offering a tantalizing glimpse into future trends.

Cost of Revenue Trends: Ryanair Holdings plc vs Hubbell Incorporated
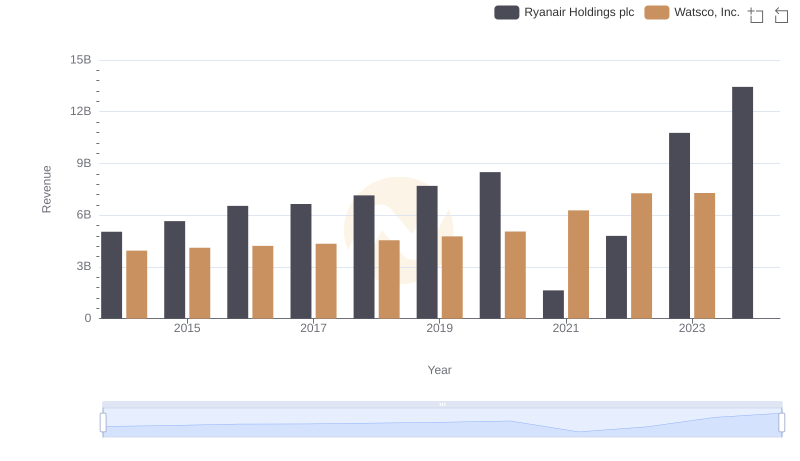
Breaking Down Revenue Trends: Ryanair Holdings plc vs Watsco, Inc.
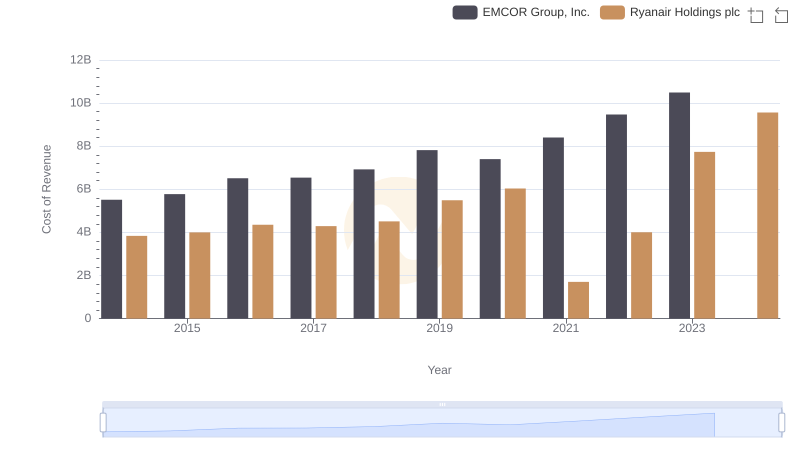
Cost of Revenue Comparison: Ryanair Holdings plc vs EMCOR Group, Inc.
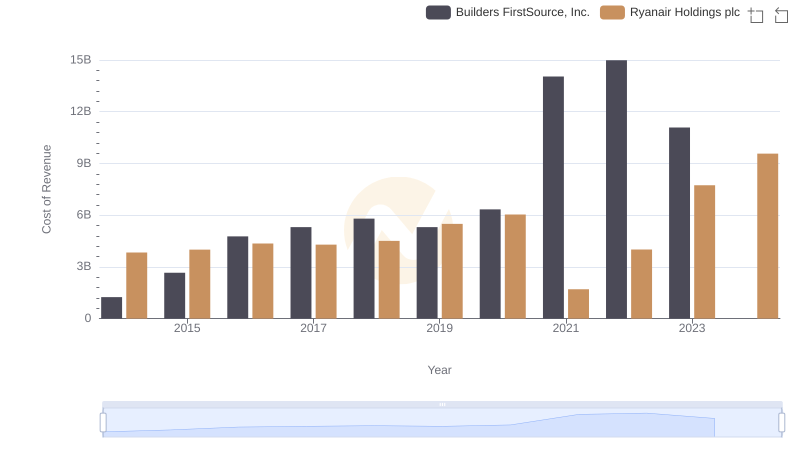
Analyzing Cost of Revenue: Ryanair Holdings plc and Builders FirstSource, Inc.

Comparing Cost of Revenue Efficiency: Ryanair Holdings plc vs Southwest Airlines Co.
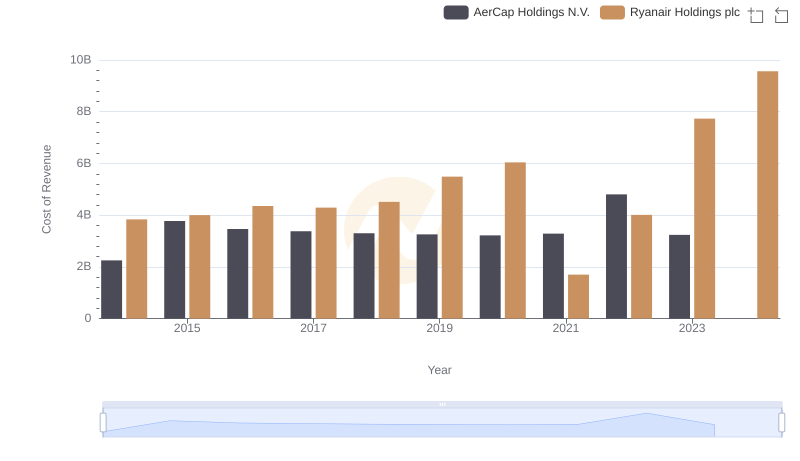
Cost of Revenue: Key Insights for Ryanair Holdings plc and AerCap Holdings N.V.
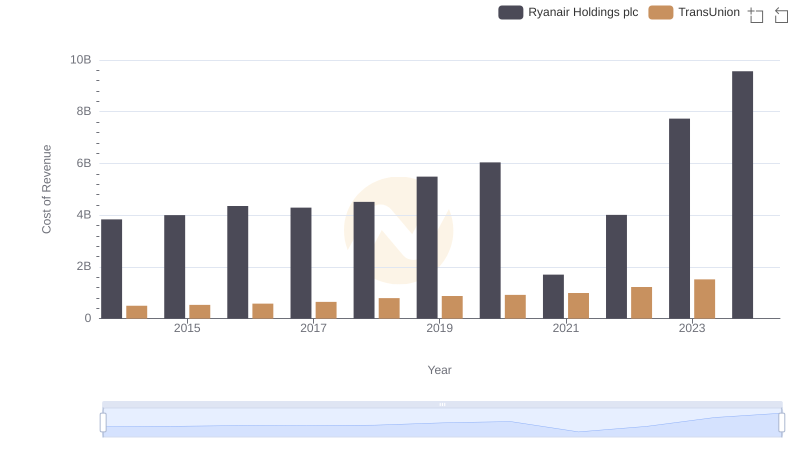
Ryanair Holdings plc vs TransUnion: Efficiency in Cost of Revenue Explored
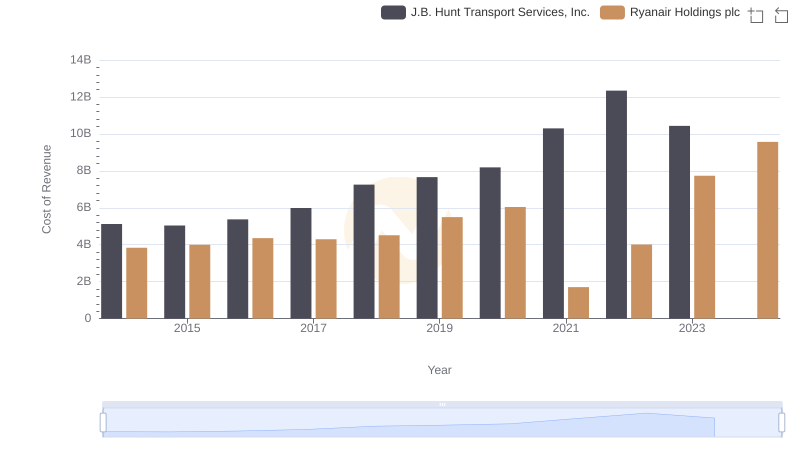
Ryanair Holdings plc vs J.B. Hunt Transport Services, Inc.: Efficiency in Cost of Revenue Explored
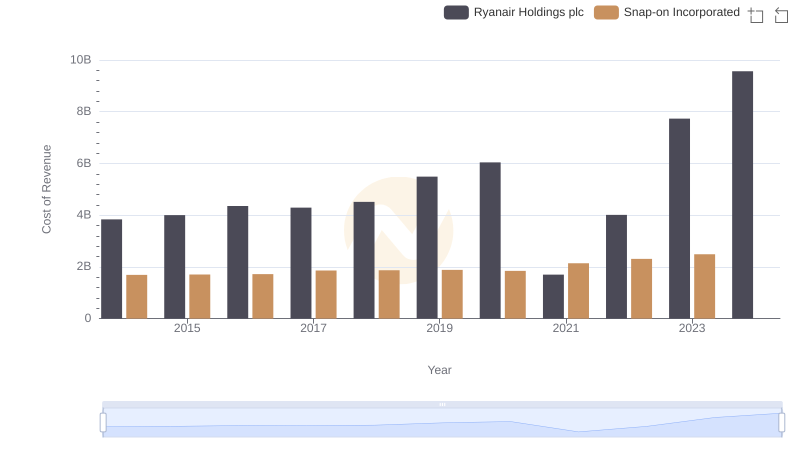
Comparing Cost of Revenue Efficiency: Ryanair Holdings plc vs Snap-on Incorporated
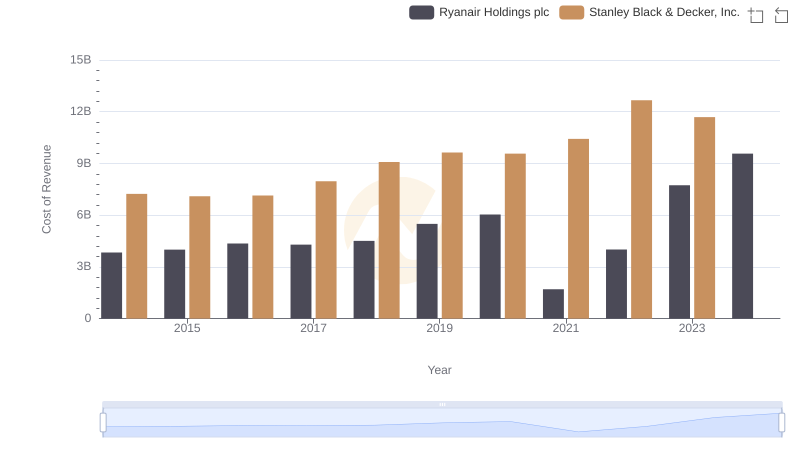
Cost of Revenue Trends: Ryanair Holdings plc vs Stanley Black & Decker, Inc.
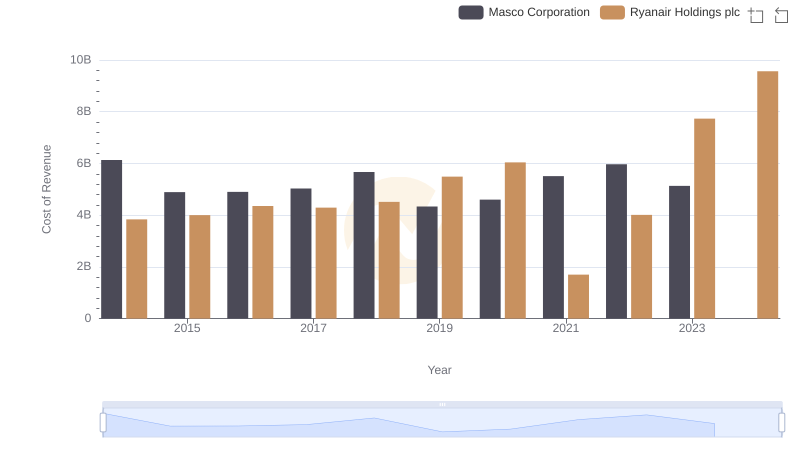
Cost of Revenue Trends: Ryanair Holdings plc vs Masco Corporation