| __timestamp | II-VI Incorporated | VMware, Inc. |
|---|---|---|
| Wednesday, January 1, 2014 | 103218000 | 1526000000 |
| Thursday, January 1, 2015 | 136058000 | 1395000000 |
| Friday, January 1, 2016 | 149699000 | 1548000000 |
| Sunday, January 1, 2017 | 189234000 | 1819000000 |
| Monday, January 1, 2018 | 221316000 | 2181000000 |
| Tuesday, January 1, 2019 | 243595000 | 3495000000 |
| Wednesday, January 1, 2020 | 246363000 | 2479000000 |
| Friday, January 1, 2021 | 682558000 | 3646000000 |
| Saturday, January 1, 2022 | 689840000 | 3446000000 |
| Sunday, January 1, 2023 | 613001000 | 3273000000 |
| Monday, January 1, 2024 | 682936000 |
Cracking the code
In the ever-evolving landscape of technology and innovation, understanding financial performance is crucial. Over the past decade, VMware, Inc. and II-VI Incorporated have showcased distinct trajectories in their EBITDA performance. VMware, a leader in cloud infrastructure, consistently outperformed with an average EBITDA of approximately $2.5 billion, peaking in 2021 with a 146% increase from 2014. Meanwhile, II-VI Incorporated, a key player in engineered materials, demonstrated a more volatile journey, with a notable 720% growth from 2014 to 2021, before a sharp decline in 2023.
This analysis underscores the importance of strategic financial planning in navigating the competitive tech industry.
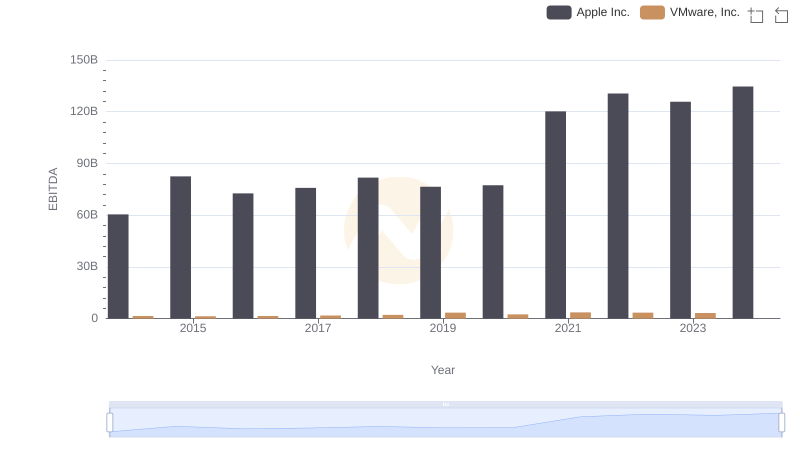
EBITDA Metrics Evaluated: Apple Inc. vs VMware, Inc.
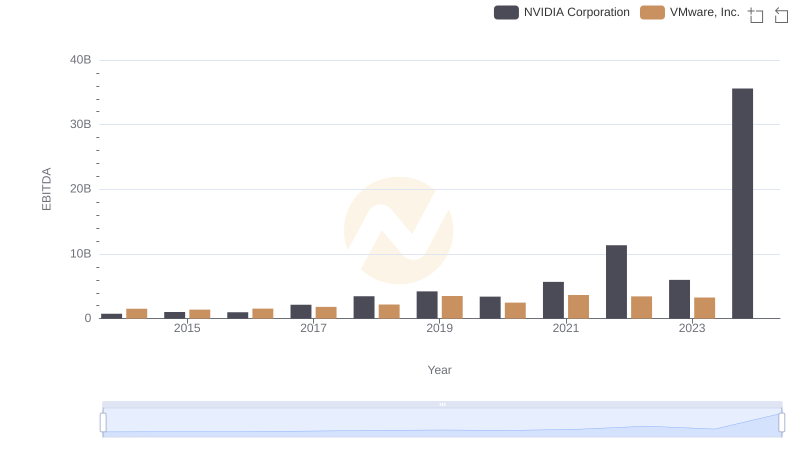
Comparative EBITDA Analysis: NVIDIA Corporation vs VMware, Inc.
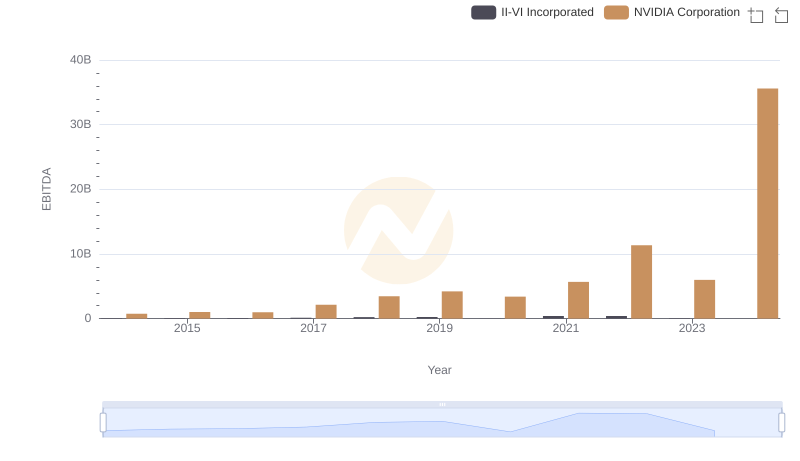
Comparative EBITDA Analysis: NVIDIA Corporation vs II-VI Incorporated
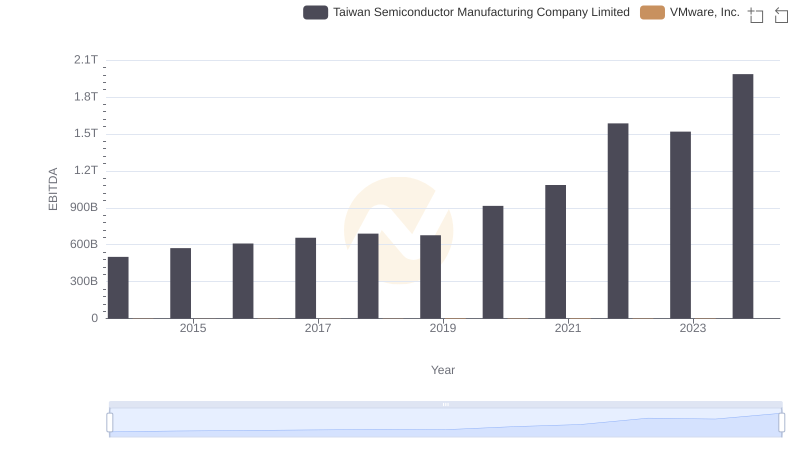
EBITDA Metrics Evaluated: Taiwan Semiconductor Manufacturing Company Limited vs VMware, Inc.
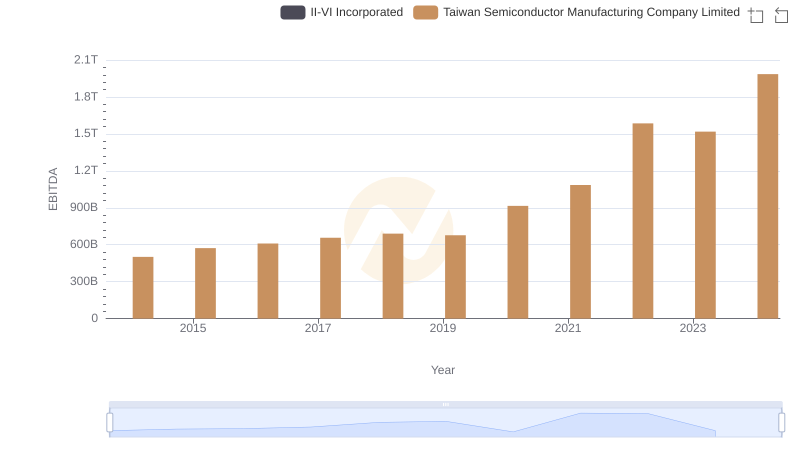
Comparative EBITDA Analysis: Taiwan Semiconductor Manufacturing Company Limited vs II-VI Incorporated
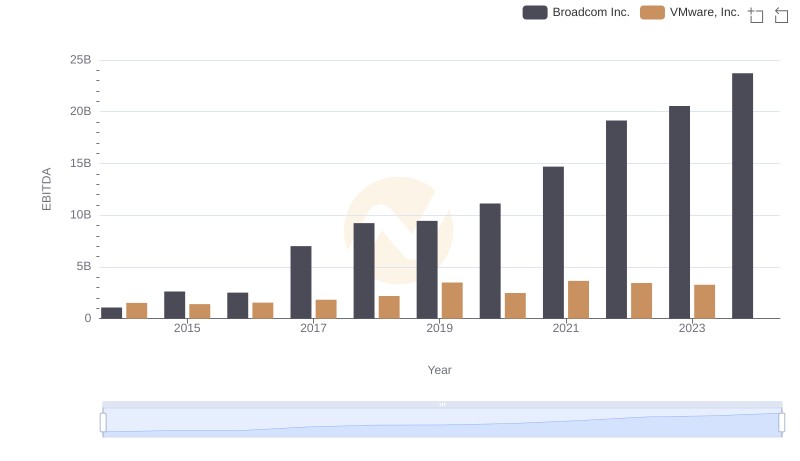
Broadcom Inc. and VMware, Inc.: A Detailed Examination of EBITDA Performance
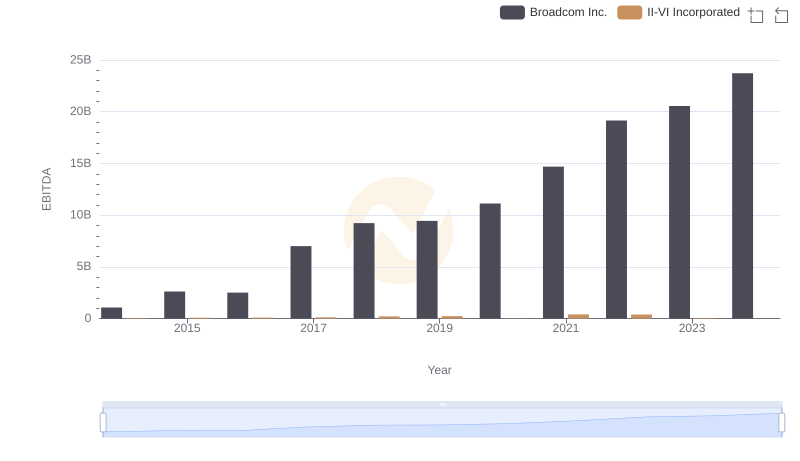
Comprehensive EBITDA Comparison: Broadcom Inc. vs II-VI Incorporated
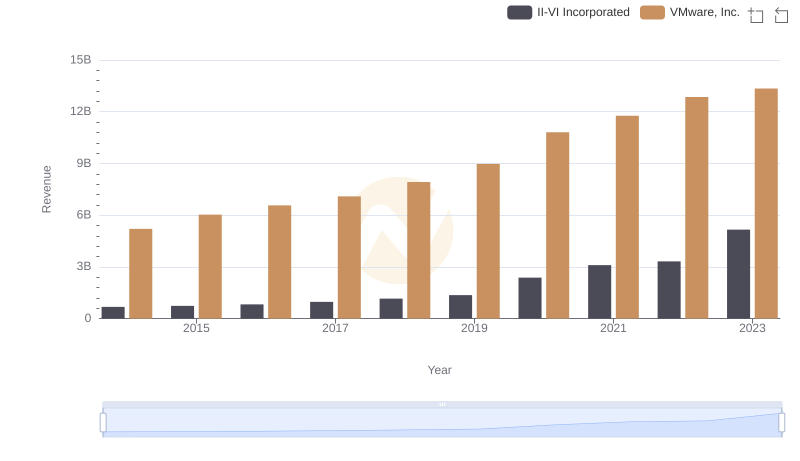
VMware, Inc. vs II-VI Incorporated: Examining Key Revenue Metrics
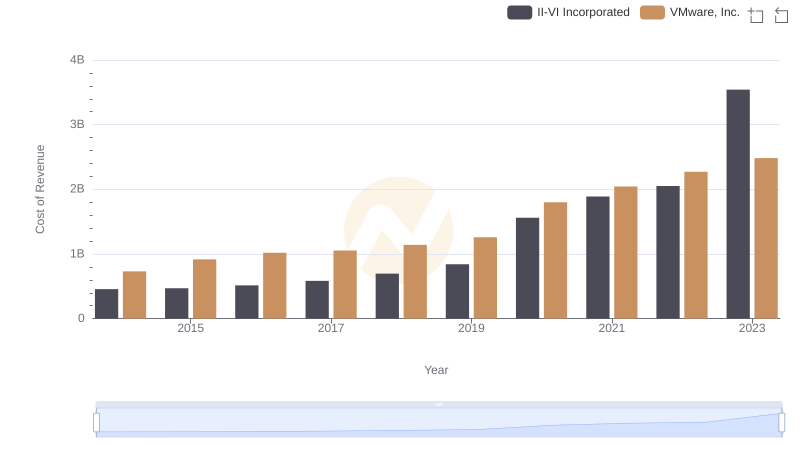
Cost of Revenue Comparison: VMware, Inc. vs II-VI Incorporated
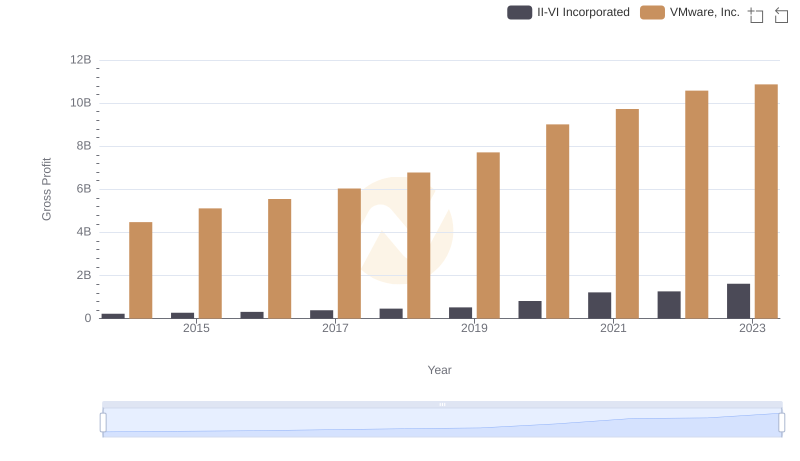
Gross Profit Analysis: Comparing VMware, Inc. and II-VI Incorporated
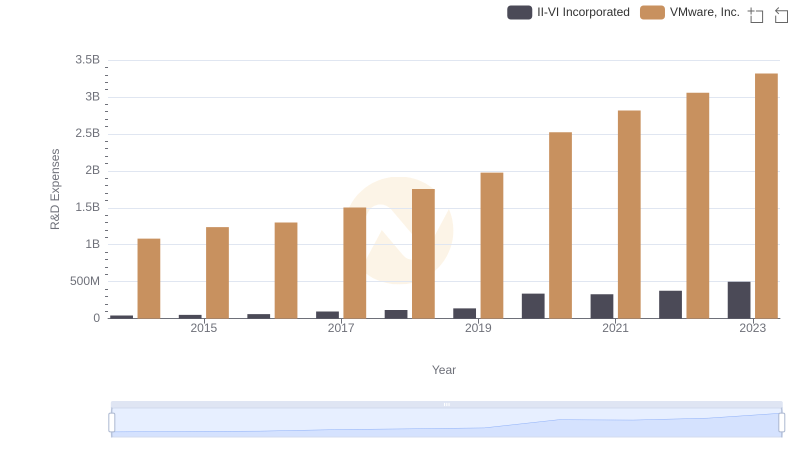
Comparing Innovation Spending: VMware, Inc. and II-VI Incorporated
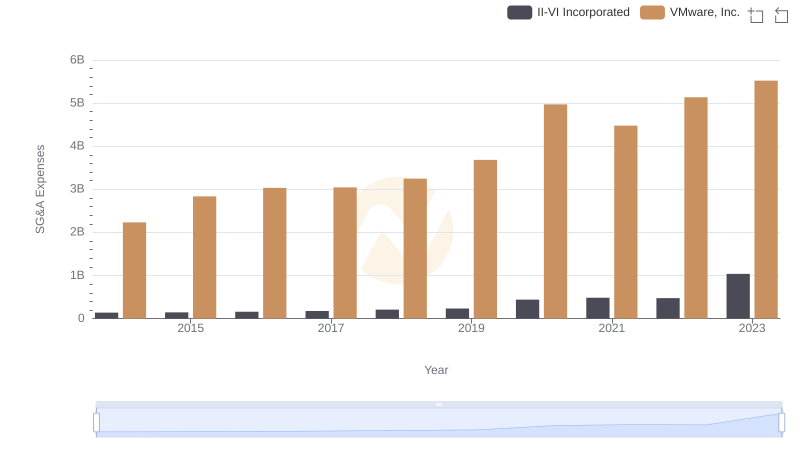
Who Optimizes SG&A Costs Better? VMware, Inc. or II-VI Incorporated